Power Platform Checker
Do you use the Power Platform Checker task in Microsoft’s Power Platform Build Tools for Azure DevOps as a quality gate in your DevOps pipeline? Let’s investigate its functionality and show how we can use it to ensure quality issues are identified early and often.
Quality Check
The Power Platform Checker task runs the same battery of tests as the Solution Checker in the maker portal or by running the checker via the Power Platform CLI: pac solution check. The key benefit of running the Power Platform Checker as a task in a DevOps pipeline is to ensure that the checker is consistently run. It can be run as part of a validation build to stop issues from entering the main/master branch. Via a branch policy a pull request can trigger a validation build that runs the checker, and if the checker is not passed the build can fail. To repeat: The aim here is to prevent issues identified by the Power Platform checker from being introduced into the main/master branch.
Here is a minimal DevOps YAML pipeline that exports a solution from an environment and runs the checker:
trigger:
- main

pool:
  vmImage: ubuntu-latest

steps:
- task: PowerPlatformToolInstaller@2

- task: PowerPlatformExportSolution@2
  inputs:
    authenticationType: 'PowerPlatformSPN'
    PowerPlatformSPN: 'PC Dev ADO Service Connection PPBT Solution Checker'
    SolutionName: 'PCSolutionCheckerPPBT'
    SolutionOutputFile: '$(Pipeline.Workspace)/bin/PCSolutionCheckerPPBT.zip'
    AsyncOperation: true
    MaxAsyncWaitTime: '60'


# Run checker in default configuration for 'solution checker' ruleset
- task: PowerPlatformChecker@2
  inputs:
    authenticationType: 'PowerPlatformSPN'
    PowerPlatformSPN: 'PC Dev ADO Service Connection PPBT Solution Checker'
    FilesToAnalyze: '$(Pipeline.Workspace)/**/*.zip'
    RuleSet: '0ad12346-e108-40b8-a956-9a8f95ea18c9'   # solution checker
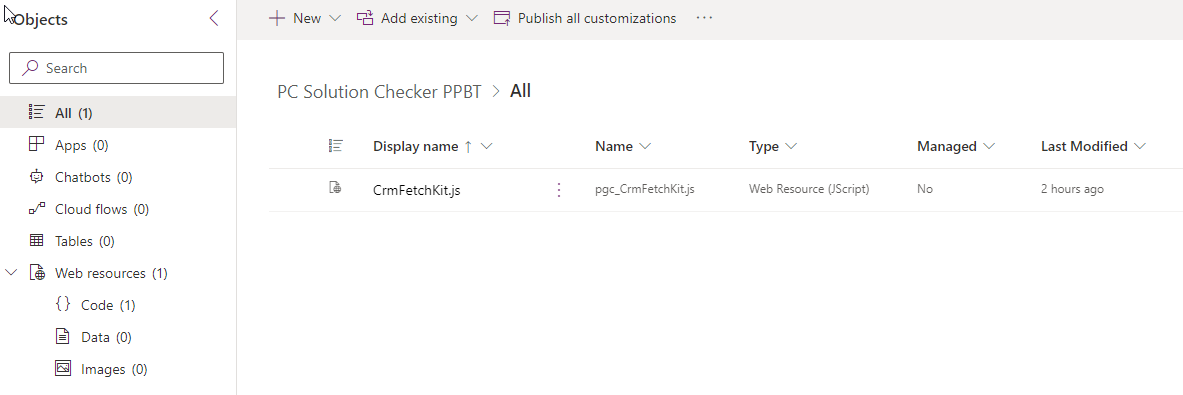
The PCSolutionCheckerPPBT just contains just one webresource CrmFetchKit which was commonly used to query Dynamics CRM via the OData v2 endpoint before Xrm.WebAPI became available.
CrmFetchKit will trigger a number of errors/warnings of varying severity, as reported by the solution checker in the maker portal.
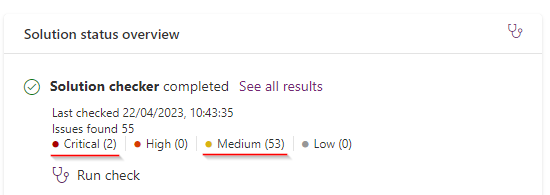
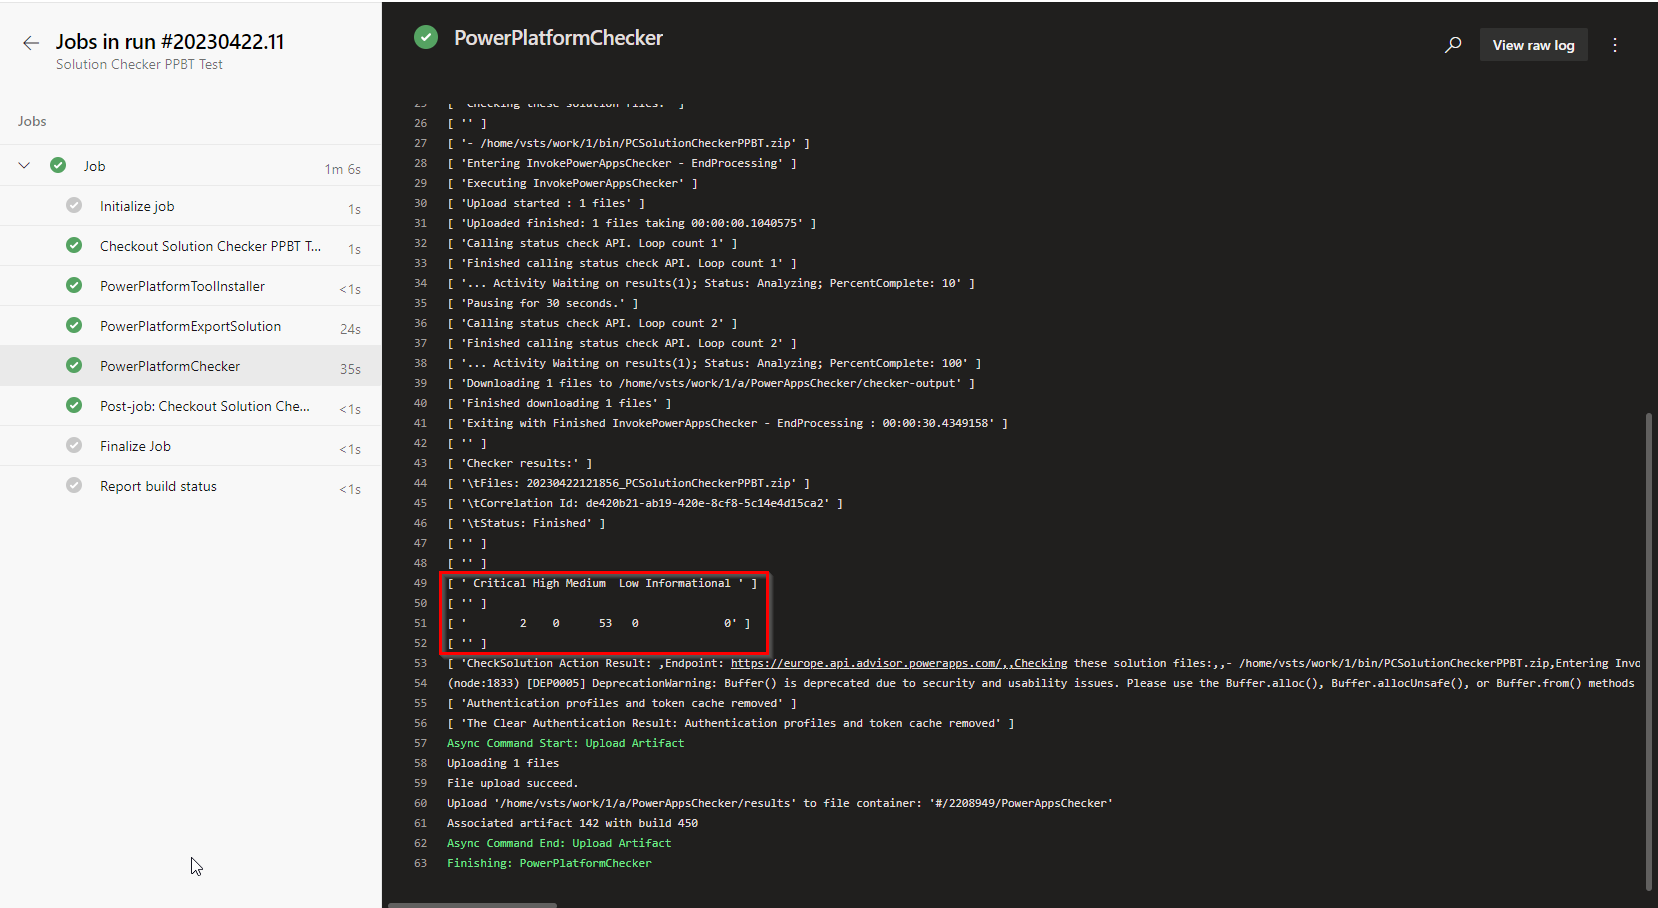
Here we can see the PPBT checker is also outputting the same issues:
Introducing a quality check
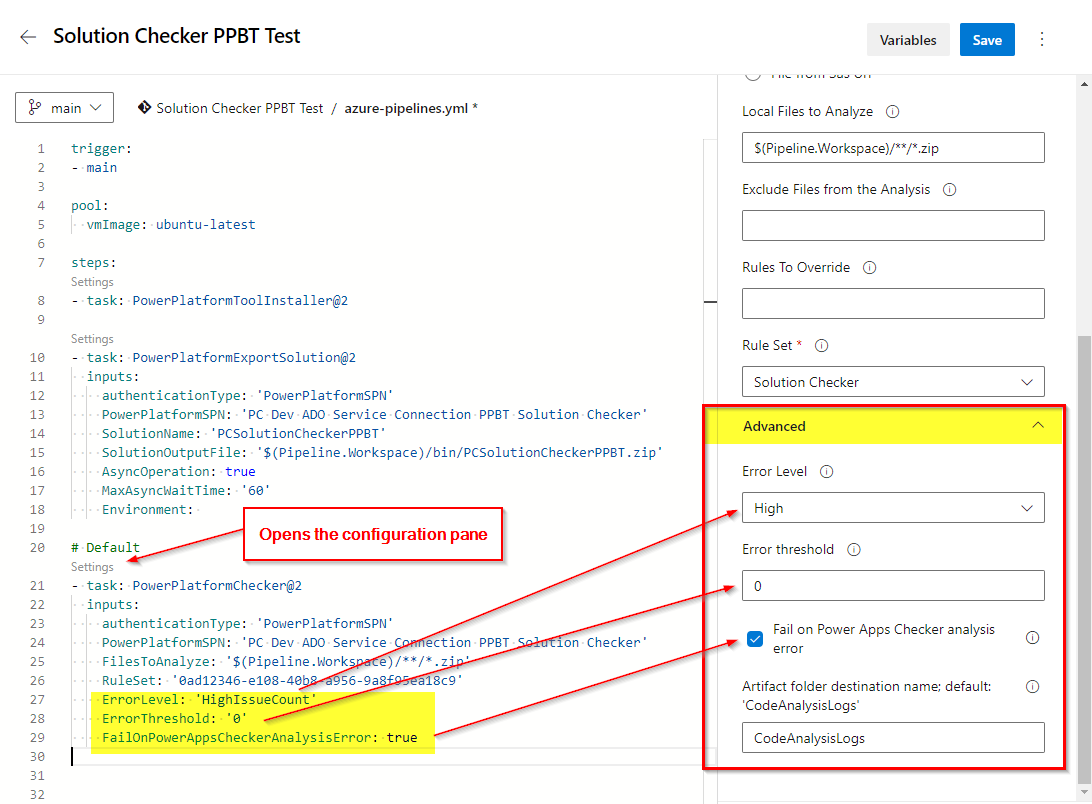
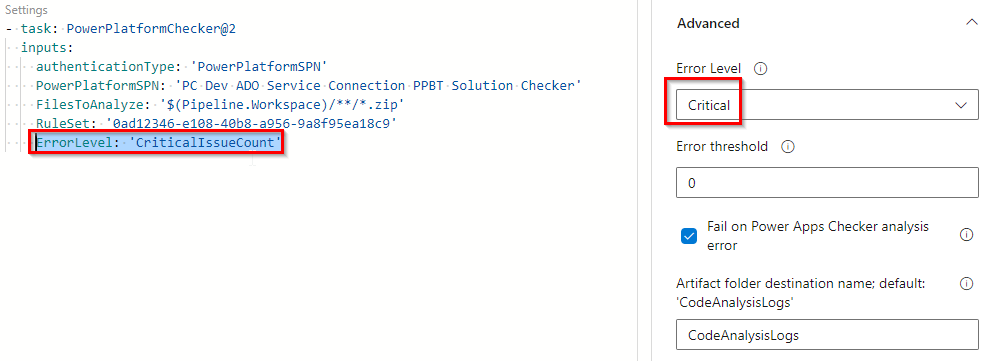
Our goal is to maintain/increase quality, so we want this build to fail, especially in this instance since two critical issues have been identified. In the advanced options of the checker configuration there are options for:
| Setting | Description | Options | Default |
|---|---|---|---|
| Error Level | Set the minimum issue level to treat as errors | Critical, High, Medium, Low, Informational | High |
| Error threshold | Set a value for the error threshold to fail if the result count is greater than the value. | Whole number | 0 |
| Fail on Power Apps Checker analysis error | Fail if the Power Apps Checker analysis is returned as Failed or FinishedWithErrors | true/false | true |
Default values
When using the ‘settings’ link in Azure DevOps pipelines it’s useful to note that the YAML generated will not contain settings that are at their default value.
Breaking the build!
When setting the error level to Critical, with a zero error threshold the build will fail. If the error threshold was two or higher the build would succeed.
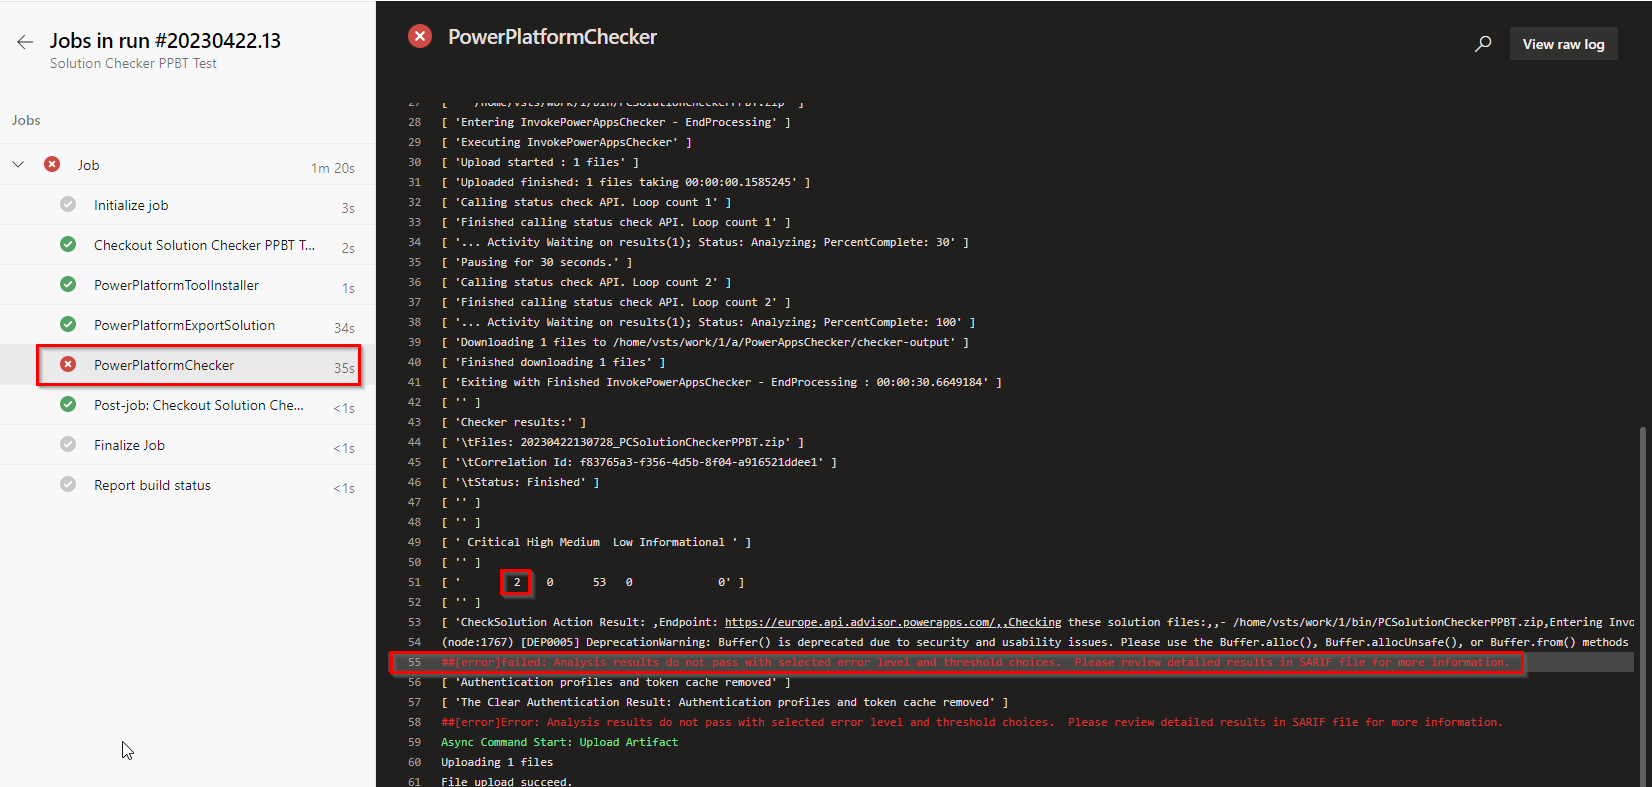
Here’s a summary of the behaviour of the checker task for this solution with different error levels, all with zero error threshold
| Error Level | Build success/failure |
|---|---|
| Critical | Fails (2 critical errors found) |
| High | Succeeds (0 high errors found) |
| Medium | Fails (53 medium errors found) |
| Low | Succeeds (0 low errors found) |
| Informational | Succeeds (0 information errors found) |
Gotcha!
I’m not sure if this is a bug or not, but as of writing the Checker task will only fail if the number of issues at the exact Error level configured in the task exceeds the Error threshold.
Catching errors at any level
There are two ways break the build for all each severity of issue.
1. Run the Power Platform Checker multiple times
One could include the DevOps task multiple times in a devops pipeline, configured at each level with different and threshold. This is a low code option, but will increase the run-time of a build, and will output multiple artifacts to the pipeline (see below), so therefore is not recommended.
2. Parse the solution checker output manually
Rather than running the checker multiple times, it’s possible to parse the output via a PowerShell script that checks the number of issues at each severity level is not exceeded. This can give more granular control.
A good example of such a script is part of Wael Hamze’s Power DevOps tooling: https://github.com/WaelHamze/xrm-ci-framework/blob/master/MSDYNV9/Xrm.Framework.CI/Xrm.Framework.CI.PowerShell.Scripts/CheckerQualityGate.ps1
Investigating the errors
The solution checker outputs errors to a pipeline artifact CodeAnalysisLogs in SARIF format.
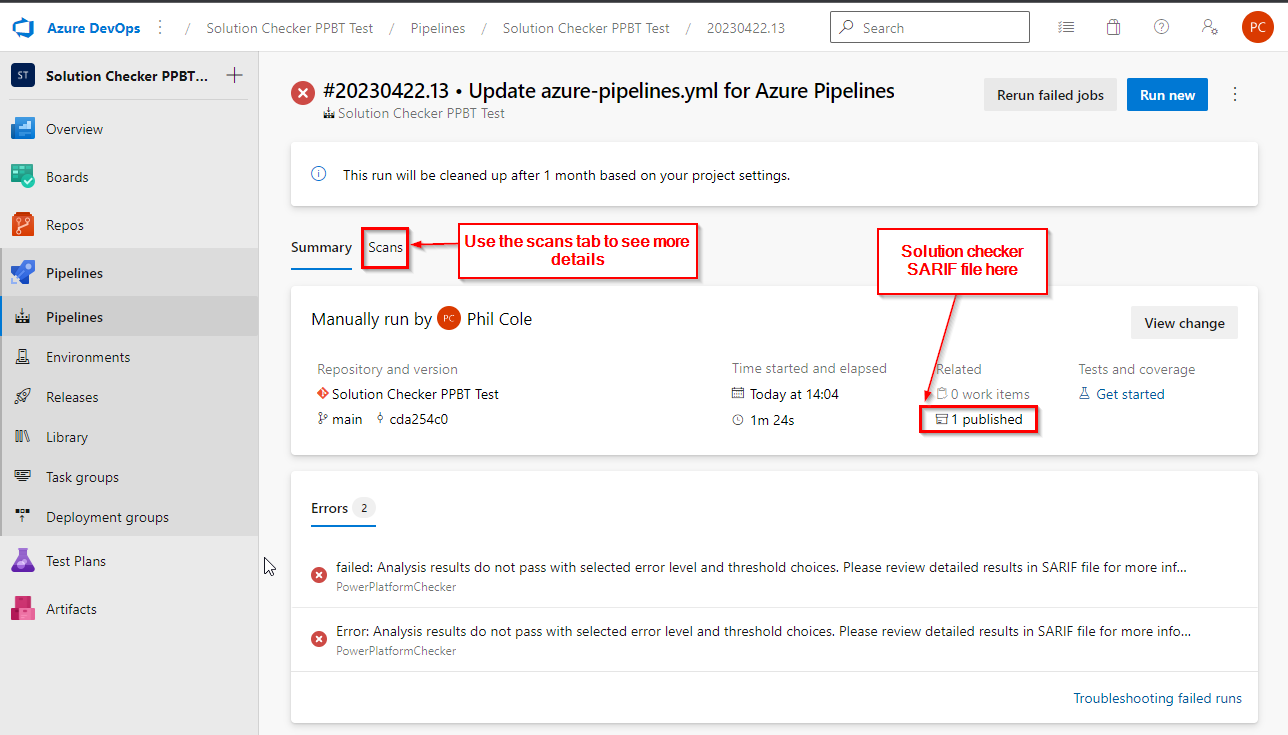
If one installs the Sarif Viewer Build Tab Azure DevOps extension then a integrated SARIF viewer will be shown
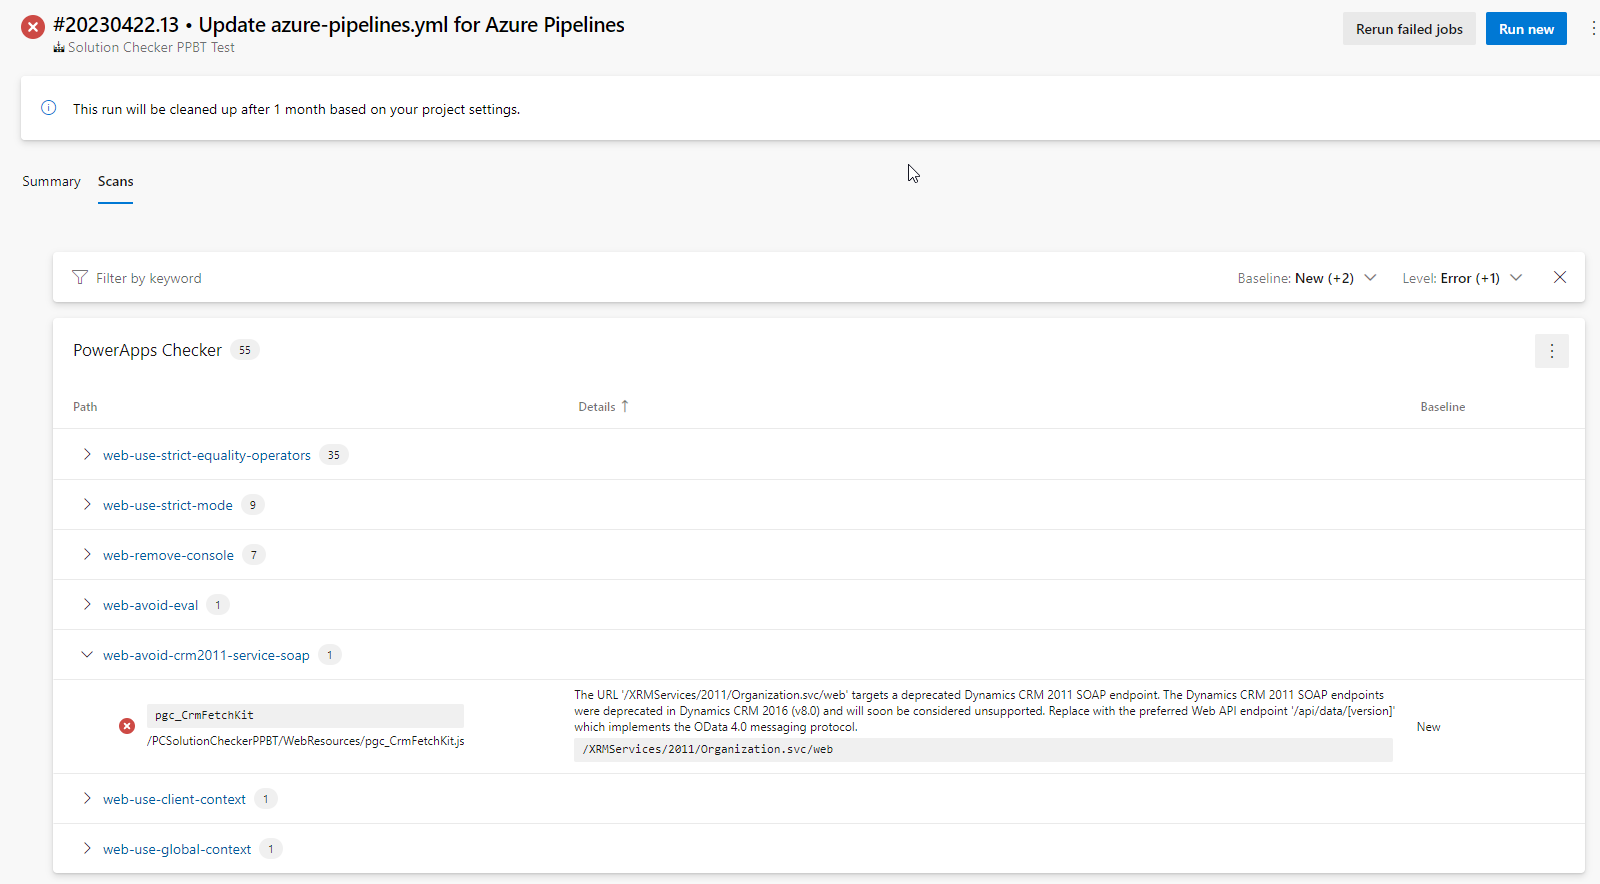
Alternatively one can upload the artifact produced to the public SARIF viewer, or use the VSCode Sarif Viewer extension
Conclusion
- The Power Apps Checker is a really valuable tool to monitor and increase or preserve quality.
- The Power Apps Checker task will only fail a build if the issues at the specified error level exceed the error threshold. This can allow builds to succeed even if there are issues present with a higher severity!
- Using a PowerShell script to parse the output of the checker allows more control of when to fail a build without increasing the build time.
- The Azure DevOps SARIF viewer extension offers convenient viewing of the solution checker results.
References
Microsoft
- Use solution checker to validate your model-driven apps in Power Apps
- SARIF Viewer Build Tab
- VSCode SARIF Viewer Extension